Vintage Pokémon market report
Built from the last seven days of the desk's data log — 13 rebuilds. Every line traces to a documented sale or a live listing.
Twelve months, every index
Index levels
| Index | Level | 1M | 3M | YTD | 1Y |
|---|---|---|---|---|---|
| .AGG | 5,021.7 | -13.1% | +22.4% | +151.1% | +164.3% |
| .VPI | 4,115.4 | -14.9% | +28.5% | +133.0% | +144.0% |
| .GLDSTR | 7,729.3 | -13.4% | +27.2% | +253.4% | +277.6% |
| .PONCHO | 4,134.4 | -3.5% | -6.2% | +57.6% | +64.7% |
Marks that moved this week — 287 card × grade rows
| Card | From | To | Change |
|---|---|---|---|
| Jigglypuff CoroCoro Comics Promos (JP) #039 PSA 9 | $366 | $134,200 | +36566.7% |
| Mudkip ★ Team Rocket Returns 107/109 PSA 10 | $20,400 | $610,000 | +2890.2% |
| Alakazam ★ Crystal Guardians 99/100 PSA 10 | $31,720 | $139,200 | +338.8% |
| Espeon Neo Discovery #1 · Unlimited PSA 2 | $39 | $144 | +269.2% |
| Umbreon ★ POP Series 5 17/17 PSA 10 | $216,000 | $597,050 | +176.4% |
| Gengar Fossil (JP) #94 PSA 3 | $52 | $129 | +148.1% |
| Espeon ★ POP Series 5 16/17 PSA 10 | $204,000 | $466,700 | +128.8% |
| Pikachu ★ Holon Phantoms 104/110 PSA 10 | $155,000 | $343,499 | +121.6% |
| Mew ★ δ Dragon Frontiers 101/101 PSA 10 | $192,000 | $392,690 | +104.5% |
| Golem Skyridge #148 PSA 5 | $597 | $1,200 | +101.0% |
| Jolteon ★ Power Keepers 101/108 PSA 7 | $2,500 | $4,723 | +88.9% |
| Dark Espeon Neo Destiny #4 · 1st Ed PSA 6 | $1,200 | $2,226 | +85.5% |
| Ho-oh Neo Revelation #7 · Unlimited PSA 5 | $230 | $405 | +76.1% |
| Gyarados Legendary Collection #12 · Reverse Holo PSA 10 | $252,000 | $66,000 | -73.8% |
| Entei ★ Unseen Forces 113/115 PSA 10 | $22,670 | $37,840 | +66.9% |
The fifteen biggest of 287 moves this week. Each row's mark at the end of the week against where it stood before it; each move is a mark reset by a documented sale. The sale behind every one of them, with its date and source link, the biggest prints of the week and the listings that sold are on the desk.
The week, on the desk.
The dashboard: market pulse, the biggest prints of the week with their receipts, the sold-off listings, the Gold Star movers and the desk's own X posts. Free — a member account takes one email.
Day-by-day detail: 3 Nov 2026 · 2 Nov 2026 · 1 Nov 2026 · 31 Oct 2026 · 30 Oct 2026 · 29 Oct 2026 · 28 Oct 2026. What sold, week by week →
Month by month
| Month | .AGG | .VPI | .GLDSTR | .PONCHO | .JPN |
|---|---|---|---|---|---|
| Nov 2026 | 5021.7 -13.1% | 4115.4 -14.9% | 7729.3 -13.4% | 4134.4 -3.5% | 4466.4 -4.2% |
| Oct 2026 | 5775.4 +18.5% | 4835.9 +28.0% | 8924.7 +15.7% | 4285.0 -5.2% | 4663.2 +12.4% |
| Sep 2026 | 4874.3 +18.8% | 3779.5 +18.0% | 7715.2 +26.9% | 4518.7 +2.5% | 4149.6 +2.6% |
| Aug 2026 | 4102.9 +8.3% | 3203.5 +4.5% | 6078.5 +15.5% | 4408.1 +4.1% | 4045.0 +1.8% |
| Jul 2026 | 3790.2 +7.3% | 3065.1 +2.3% | 5262.8 +17.5% | 4235.9 +3.4% | 3971.7 -1.9% |
| Jun 2026 | 3532.8 +8.0% | 2997.3 +6.4% | 4480.1 +12.8% | 4096.1 +4.1% | 4047.9 +4.1% |
| May 2026 | 3272.1 +9.4% | 2815.9 +9.1% | 3970.5 +14.5% | 3933.1 +2.6% | 3888.8 +5.5% |
| Apr 2026 | 2990.5 +9.8% | 2581.1 +8.9% | 3467.5 +11.7% | 3833.4 +9.6% | 3687.0 +8.1% |
| Mar 2026 | 2723.2 +13.3% | 2370.9 +13.7% | 3104.7 +14.2% | 3496.9 +11.3% | 3410.1 +26.8% |
| Feb 2026 | 2402.5 +10.9% | 2085.5 +10.9% | 2719.1 +12.2% | 3143.0 +9.0% | 2690.2 +21.0% |
| Jan 2026 | 2166.8 +8.3% | 1881.1 +6.5% | 2422.7 +10.8% | 2883.0 +9.9% | 2222.9 +18.4% |
| Dec 2025 | 2000.0 +5.3% | 1766.4 +4.7% | 2186.9 +6.8% | 2622.9 +4.5% | 1877.7 +10.5% |
| Nov 2025 | 1900.1 | 1686.6 | 2046.8 | 2509.5 | 1698.7 |
Index levels at each month close, with the change on the month beside them. The base is October 2022 = 1,000; a level of 4,000 means the basket is four times its base.
Every month on file
A permanent page per month — the record as at that close, which is the link to hand anyone writing about the market.
Questions the desk answers
Use this chart
The chart and the monthly index levels on this page are free to use — in a video, a newsletter, a thread or an article — with credit to Vintage Chase Tracker and a link to vintagechasetracker.com/market/. A 1200×630 image of this chart is at /og/market.png, and the raw monthly levels are in digest.json.
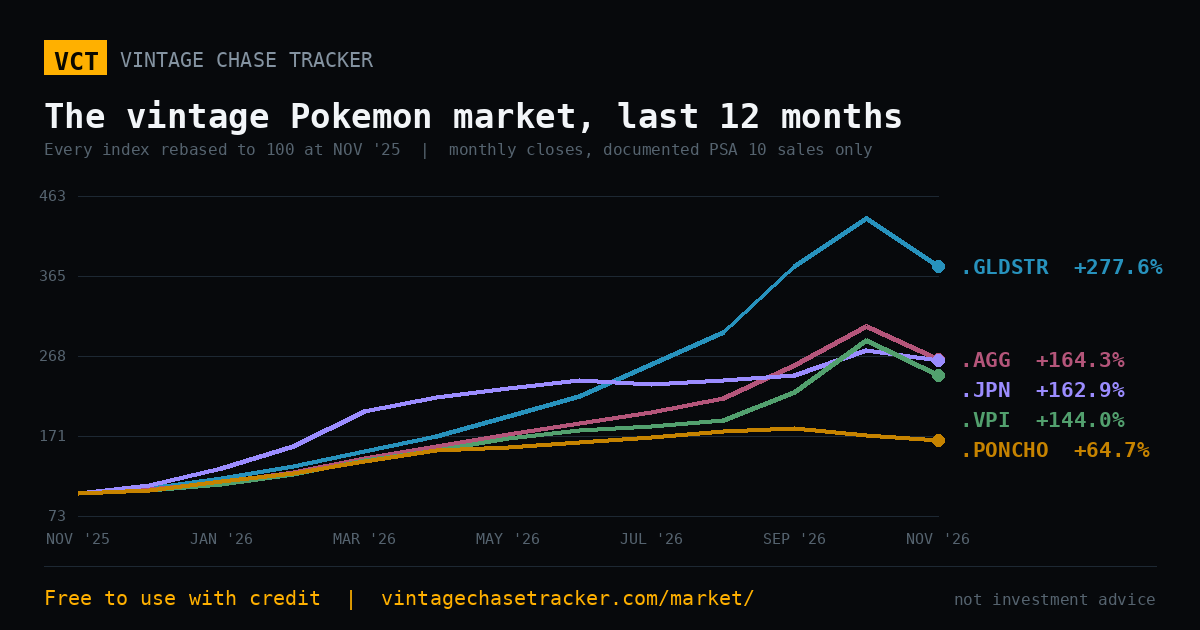
Every level is built from documented PSA 10 sales — a dated sale with its source, never an asking price and never an estimate. How the marks are set. Entertainment and research only; not investment advice.
Cite this pageVintage Chase Tracker, “Vintage Pokémon Market This Week”, vintagechasetracker.com/market/, data as of 3 Nov 2026. Free to quote with a link; documented PSA sales, not advice.